
We all dream of a big win, whether that’s your numbers coming up in the lottery or landing a big Slingo win. But who are the people who get all the luck?
The slots team at Slingo has delved into our database of players and the People’s Postcode Lottery data to uncover the cities, age groups, genders, and names that have statistically produced the most winners across our games. We’ve also examined how their luck has changed over the past few years.
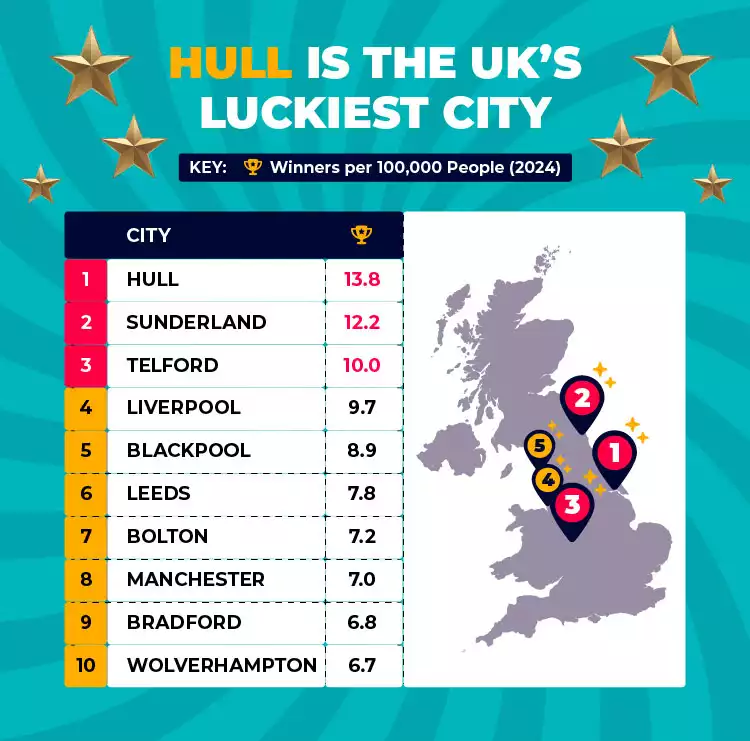
Hull is the UK’s luckiest city
|
Rank |
City |
Winners per 100,000 People (2023) |
Winners per 100,000 People (2024) |
Percentage Change (2023-2024) |
|
1 |
Hull |
10.8 |
13.8 |
29% |
|
2 |
Sunderland |
5.7 |
12.2 |
114% |
|
3 |
Telford |
3.4 |
10 |
188% |
|
4 |
Liverpool |
6.6 |
9.7 |
34% |
|
5 |
Blackpool |
6.1 |
8.9 |
41% |
|
6 |
Leeds |
6.3 |
7.8 |
23% |
|
7 |
Bolton |
5.7 |
7.2 |
26% |
|
8 |
Manchester |
6.6 |
7.0 |
6% |
|
9 |
Bradford |
5.3 |
6.8 |
28% |
|
10 |
Wolverhampton |
3.8 |
6.7 |
75% |
If you want to feel lucky, it might be time to move to Hull! The East Yorkshire city has a win rate of 13.8 per 100,000 people. The city’s residents have also seen a 29% increase in their win rate between 2023 and 2024.
Hot on Hull’s heels is Sunderland, where luck has more than doubled in just a year. The northern city recorded 12.2 winners per 100,000 people, up from just 5.7 in 2023. Meanwhile, Telford in Shropshire takes third place with 10 winners per 100,000, marking a 188% increase in lucky breaks.
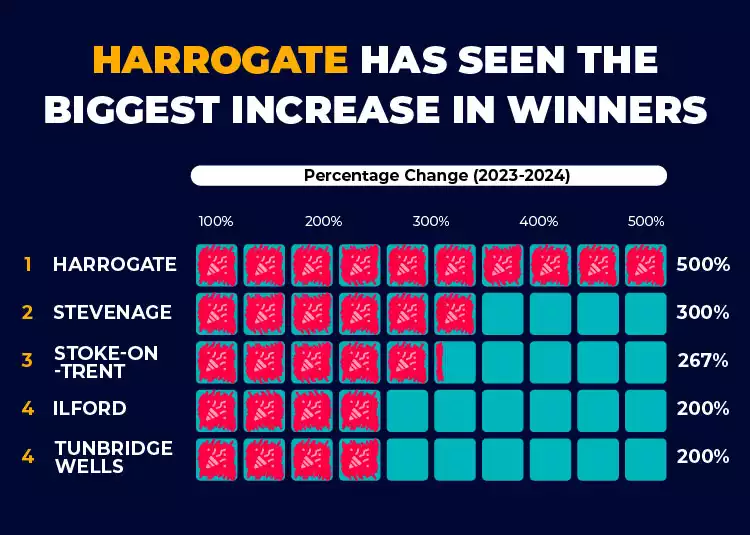
Harrogate has seen the biggest increase in winners
|
Rank |
City |
Winners per 100,000 People (2023) |
Winners per 100,000 People (2024) |
Percentage Change (2023-2024) |
|
1 |
Harrogate |
0.7 |
4.3 |
500% |
|
2 |
Stevenage |
0.7 |
2.7 |
300% |
|
3 |
Stoke-on-Trent |
0.5 |
1.7 |
267% |
|
4 |
Ilford |
0.5 |
1.6 |
200% |
|
4 |
Tunbridge Wells |
0.1 |
0.4 |
200% |
|
6 |
Taunton |
1.1 |
3.4 |
200% |
|
6 |
Canterbury |
0.4 |
1.2 |
200% |
|
8 |
Telford |
3.4 |
9.7 |
188% |
|
9 |
Enfield |
0.5 |
1.4 |
150% |
|
10 |
Carlisle |
1.3 |
3.1 |
150% |
Harrogate has had the biggest increase in winners over the past year. The Yorkshire town has seen a whopping 500% increase in winners per 100,000 people.
Up next is the much larger town of Stevenage, where winners per 100,000 have tripled (300% increase), and Stoke-on-Trent, which rounds out the top three with a 267% boost.
Four towns have lost their lucky streak
|
Rank |
City |
Winners per 100,000 People (2023) |
Winners per 100,000 People (2024) |
Percentage Change (2023-2024) |
|
1 |
Llandrindod Wells |
2.0 |
0 |
-100% |
|
1 |
Dorchester |
0.9 |
0 |
-100% |
|
1 |
Lancaster |
0.9 |
0 |
-100% |
|
1 |
Kingston upon Thames |
0.5 |
0 |
-100% |
While some places are riding a wave of good fortune, others have seen their luck run out.
According to Slingo’s internal data, Llandrindod Wells, Dorchester, Lancaster, and Kingston upon Thames have all seen a 100% drop in the proportion of winners per 100,000 people, meaning players lost their lucky streaks in these areas in 2024.
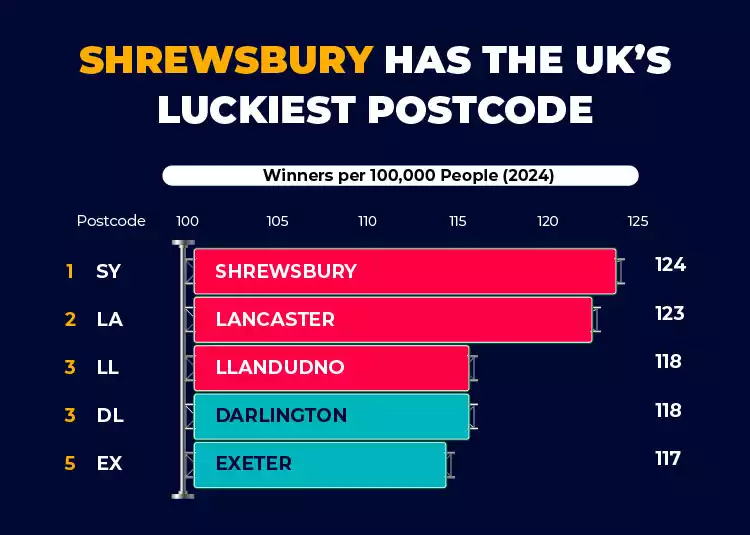
Shrewsbury has the UK’s luckiest postcode
|
Rank |
Postcode |
Area |
Winners per 100,000 People (2023) |
Winners per 100,000 People (2024) |
Percentage Change (2023-2024) |
|
1 |
SY |
Shrewsbury |
77 |
124 |
61.5% |
|
2 |
LA |
Lancaster |
75 |
123 |
62.8% |
|
3 |
LL |
Llandudno |
78 |
118 |
51.8% |
|
4 |
DL |
Darlington |
77 |
118 |
53.8% |
|
5 |
EX |
Exeter |
76 |
117 |
54.2% |
|
6 |
SA |
Swansea |
72 |
111 |
54.8% |
|
7 |
TA |
Taunton |
71 |
111 |
56.5% |
|
8 |
HR |
Hereford |
70 |
105 |
51.2% |
|
9 |
TF |
Telford |
74 |
103 |
39.4% |
|
10 |
TQ |
Torquay |
70 |
103 |
47.4% |
We also examined the number of winners in the People's Postcode Lottery to uncover which postcodes are the luckiest.
While larger cities like Birmingham, Manchester, and Sheffield had the most wins overall, Shrewsbury takes the title when it comes to wins per 100,000 people, with 124. Following closely behind is Lancaster, with 123 per 100,000. Llandudno is the third luckiest, with 118 wins per 100,000 people.
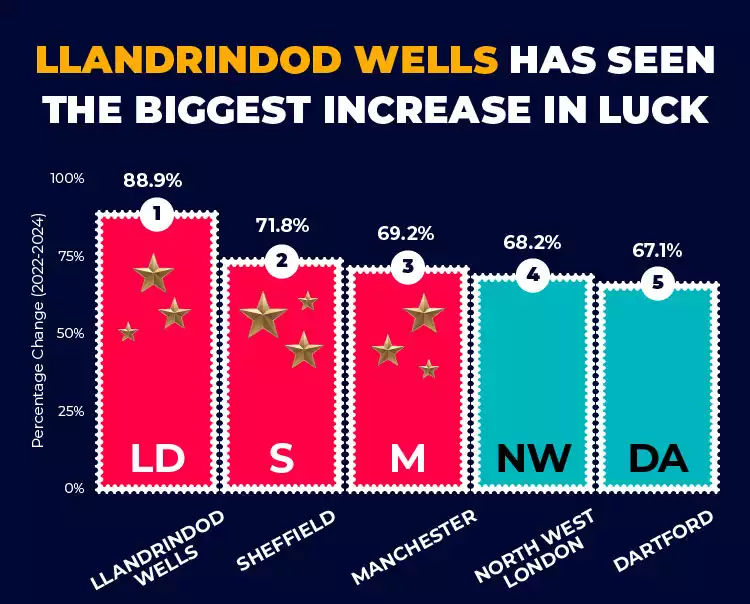
Llandrindod Wells has seen the biggest increase in luck
|
Rank |
Postcode |
Area |
Winners per 100,000 People (2022) |
Winners per 100,000 People (2024) |
Percentage Change (2022-2024) |
|
1 |
LD |
Llandrindod Wells |
54 |
101 |
88.9% |
|
2 |
S |
Sheffield |
54 |
92 |
71.8% |
|
3 |
M |
Manchester |
53 |
90 |
69.2% |
|
4 |
NW |
North West London |
19 |
32 |
68.2% |
|
5 |
DA |
Dartford |
37 |
62 |
67.1% |
|
6 |
HU |
Hull |
53 |
88 |
66.3% |
|
7 |
RG |
Reading |
50 |
83 |
66.2% |
|
8 |
CW |
Crewe |
58 |
96 |
66.0% |
|
9 |
SN |
Swindon |
50 |
82 |
65.6% |
|
10 |
OX |
Oxford |
42 |
69 |
64.2% |
When it comes to the postcode lottery, residents of one of the smallest towns on the list have seen the biggest increase in winners. Llandrindod Wells has seen an 88.9% increase in wins per 100,000 people, from 54 in 2022 to 101 in 2024.
Following Llandrindod Wells is Sheffield, with a 71.8% rise in wins, and Manchester, with an increase of 69.2%.
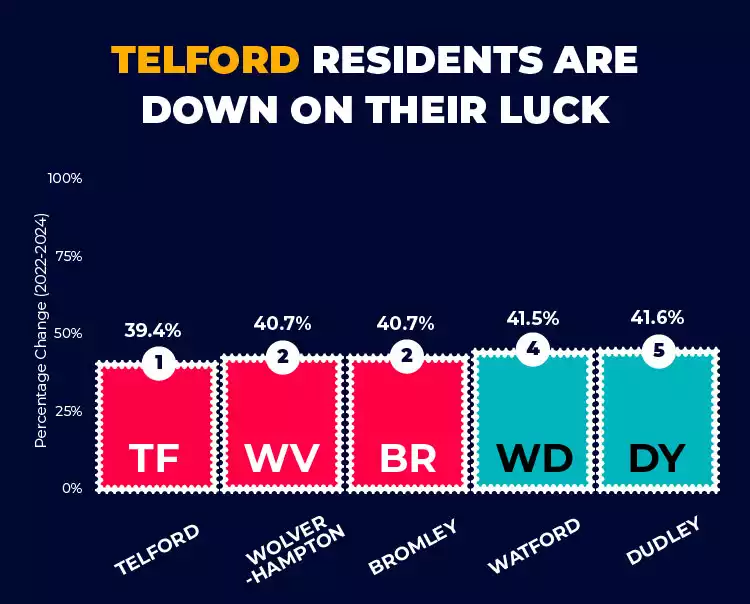
Telford residents are down on their luck
|
Rank |
Postcode |
Area |
Winners per 100,000 People (2022) |
Winners per 100,000 People (2024) |
Percentage Change (2022-2024) |
|
1 |
TF |
Telford |
74 |
103 |
39.4% |
|
2 |
WV |
Wolverhampton |
48 |
67 |
40.7% |
|
3 |
BR |
Bromley |
44 |
62 |
40.7% |
|
4 |
WD |
Watford |
44 |
62 |
41.5% |
|
5 |
DY |
Dudley |
60 |
85 |
41.6% |
|
6 |
WF |
Wakefield |
59 |
85 |
43.8% |
|
7 |
TW |
Twickenham |
36 |
52 |
44.1% |
|
8 |
HA |
Harrow |
31 |
45 |
45.2% |
|
9 |
SL |
Slough |
42 |
62 |
45.9% |
|
10 |
BH |
Bournemouth |
54 |
79 |
46.0% |
Telford residents have seen the smallest increase in Postcode Lottery wins since 2022, with win rates rising by 39.4%, 15% less than the average increase.
Wolverhampton takes second place with an increase of 40.7%, followed closely by the London Borough of Bromley with 40.71%.
Which ages are the luckiest?
|
Rank |
Age |
Proportion of Winners (2024) |
|
1 |
30-39 |
40.4% |
|
2 |
40-49 |
22.8% |
|
3 |
20-29 |
20.2% |
|
4 |
50-59 |
10.6% |
|
5 |
60+ |
6.6% |
|
6 |
<20 |
1.1% |
Age might just be a number, but the statistics of Slingo players show that your winning odds might increase if you’re between 30 and 39. This age group had the highest proportion of winners in 2024, at 40.4%.
In second place are players aged 40 to 49, with 22.77% of wins, and 20 to 29-year-olds are up next, with a win rate of 20.2%.
Players in their 50s are running out of luck
|
Rank |
Age |
Percentage Change (2023-2024) |
|
1 |
50-59 |
-8.7% |
|
2 |
60+ |
-5.0% |
|
3 |
20-29 |
-0.8% |
But it’s not good news for everyone. Players in their 50s have seen the biggest drop in luck, with their win rate falling by 8.7%.
Those aged 60+ weren’t far behind, with a win rate decrease of around 5%, followed by people in their 20s with a marginal drop of 0.8%.
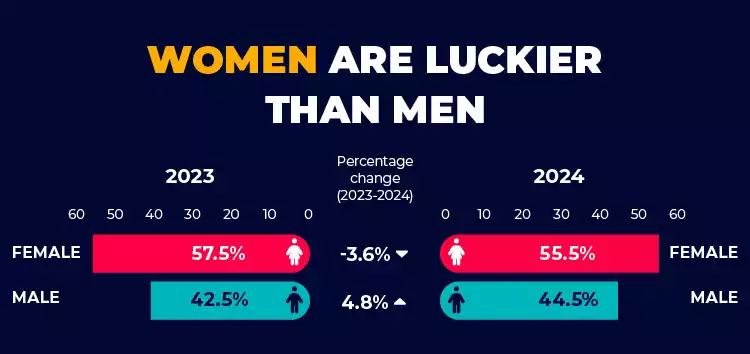
Women are luckier than men
|
Rank |
Gender |
Proportion of Winners (2023) |
Proportion of Winners (2024) |
Percentage Change (2023-2024) |
|
1 |
Female |
57.5% |
55.5% |
-3.6% |
|
2 |
Male |
42.5% |
44.5% |
4.8% |
It turns out women are still winning more than men.Women had the highest proportion of winners in 2024, at 55.5%.This left male players trailing behind with 44.5% of winners, which is more than a 10-point difference!
Despite there being fewer male than female winners in the last year, the share of male winners has risen marginally between 2023 and 2024 by 4.8%. Conversely, the win rate for women over this time fell by 3.6%.
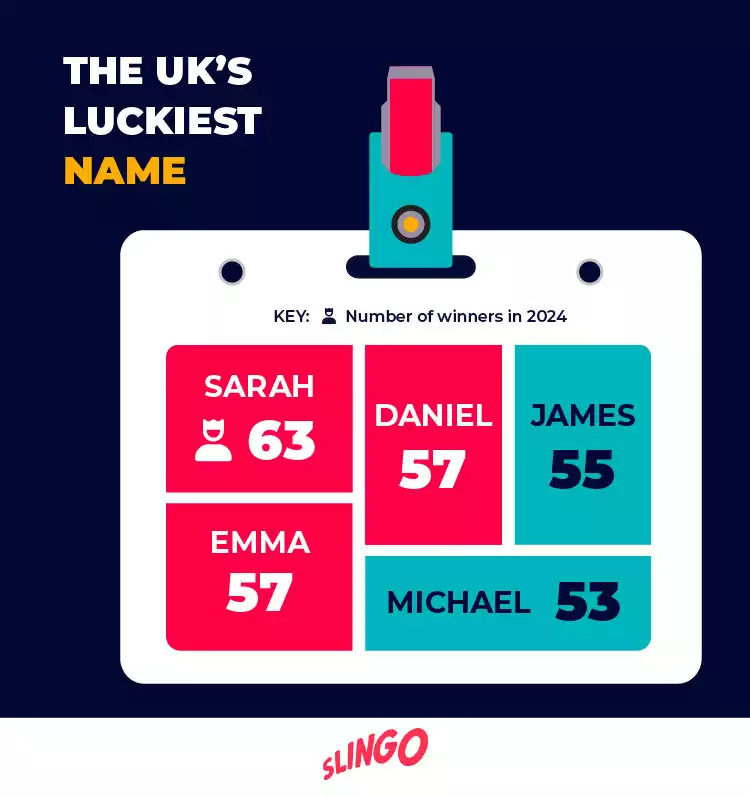
The UK’s luckiest name
|
Rank |
First name |
Number of winners in 2023 |
Number of winners in 2024 |
|
1 |
Sarah |
54 |
63 |
|
2 |
Daniel |
35 |
57 |
|
2 |
Emma |
45 |
57 |
|
4 |
James |
33 |
55 |
|
5 |
Michael |
41 |
53 |
|
6 |
David |
50 |
52 |
|
7 |
Lisa |
41 |
47 |
|
8 |
Paul |
45 |
44 |
|
9 |
Amy |
23 |
42 |
|
9 |
John |
28 |
42 |
If your name is Sarah, you might just have an extra dose of luck. It was the luckiest name for Slingo players in the UK last year, with 63 winners sharing the name. Players named Daniel and Emma share second place with 57 winners each. Players named James are only slightly behind, taking third place with 55 winners.
Slingo players named Liam have had the biggest change in luck over the past year, with a 91.7% increase in wins for players with this name. Players named Katie also saw an increase in wins, coming second with 88.2%, and those named Jordan came third with an 85.7% increase.
Methodology
All data (excluding Postcode Lottery wins) was sourced from Slingo’s own customer data and relates to the number of bets that resulted in wins across Slingo UK users between January and December 2023 and January and December 2024. The data is accurate as of February 2025.
Data on the number of People's Postcode Lottery winners was sourced from Lottery.co.uk’s Postcode Lottery Statistics and refers to the number of wins since the 6th January 2011. Data was collected on 28/01/2025 and is accurate as of then.
These were then calculated per 100,000 people in each postcode area using population figures from the UK Census.